
Introduction
United States
The report would analysis the two- macro economical variable, namely GDP growth rate and CPI with the help of data and graph. The data depicts the problems faced by the U.S economy during the time period of 2000 to 2010.During those period changes in the polices secreted a very conductive environment for exports to widen the field of role distinctive in global arena. The U.S economy underwent a series of shock in the period of 2000 to 2010, as the states experienced a recession in 2001 due to irrational exuberance in high – tech with an unusually slow job recovery along with number of jobs lost not regaining until the the year 2005.
The situation was further worsened by the irrational exuberance in the housing market that pushed majority of the investor to take advantage of the housing bubble. But sooner in 2006 the bursting of the housing bubble created a hue and cry in the U.S economy as prices of houses started declining. This two recession of 2001 and 2008 provided impetus for the further loss of employment which was a major concern behind the setting of the period of great depression of 2008.The most probable causes for the setting of depression in U.S economy were loss of confidence in investment falling housing prices and sales asset bubble burst, poor management, credit crunch and wage-price control.
Analysis
For the analysis, the method that has primarily been used in our study is that of trend analysis and forecasting. We have collected secondary data from authentic data sources such as world Bank. Herewith, we have conducted trend analysis and forecasting. The report uses actual data for 2000-2010 for both economic variable in our study.
Gross Domestic Product
Table1: Table Showing Potential GDP (at constant prices) and Actual GDP (at constant prices) of United States for 2008 to 2018.
| Year | Potential GDP (at constant price) | Actual GDP( at constant price) |
| 2000 | 12.62 | 12.62 |
| 2001 | 12.746 | 12.746 |
| 2002 | 12.968 | 12.968 |
| 2003 | 13.339 | 13.339 |
| 2004 | 13.846 | 13.846 |
| 2005 | 14.332 | 14.332 |
| 2006 | 14.742 | 14.742 |
| 2007 | 15.018 | 15.018 |
| 2008 | 14.998 | 14.998 |
| 2009 | 15.585 | 14.617 |
| 2010 | 15.932 | 14.992 |
Source: Adopted from World Bank Data
Graph1: Graph Showing Potential GDP (at constant prices) and Actual GDP (at constant prices) of United States for 2008 to 2018.
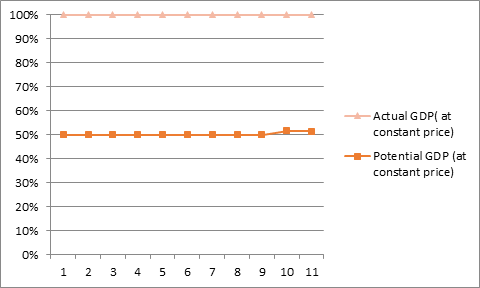
Source: created by the author using excel
The above analysis shows that the financial crisis of 2007-08 affected the economy of the United States greatly. The actual GDP of the United states after the financial crisis was lower than the forecasted or the potential GDP. This in turn shows the ineffectiveness of the government and it polices to cope up with the impact of the financial crisis. Many factors such as the market instability, decline in the housing demand, drying up of the credit well, speculation etc. lead to the break out of this subprime crisis in the united states. The effects of the crisis on the economy of the United states were huge. The stock market of the United states witnessed a bear market during that period and the financial institutions saw a complete evaporation of liquidity resulting in the collapse of financial market as a whole. Also, the real GDP of the economy fell drastically. However, the United states government tried to cope up with the crisis. In response to the crisis, United states came up with various polices with respect to legislation, banking industry and the market volatility. The government came up with various conventional as well as unconventional methods to face the crisis. The Fed along with the central banks of other countries decided to coordinate to provide liquidity support to financial institutions so that interbank market was stabilized. When the government realized that additional tools were needed to address the situation at hand, it proposed the creation of Troubled Asset Relief Program [TRAP]. The Fed also started cutting down the funds rate as well as the discount rates but it gave no effective results. The federal funds rate and discount rates were reduced to 1% and 1.75% respectively but both the liquidity support and the reduction in rates were not able to provide any results. The United States government also came out with National Economic Stabilization Act of 2008 in order to purchase about 700 billion US$ mortgage- backed securities and also with the American Recovery and Reinvestment Act, 2009.It also came up with many other acts and policies but all in vain. The Obama government also realized that to address the crisis, the regulatory framework had to be modernized which is why the Dodd- frank wall street Reform and consumer protection Act was enacted. The United states government came up with various measures and policies to address the financial crisis. All the measures taken were able to help the economy of the united states to recovery from the financial crisis but these measures were not enough for the U.S economy to reach its forecasted or potential GDP.

Consumer Price Index – A Measure of Inflation
Table 2: Table Showing Consumer Price Index and Inflation rate for United States (1996 to 2005).
| Year | Consumer price index | Inflation rate |
| 1996 | 156.9 | 60.50% |
| 1997 | 160.5 | 63% |
| 1998 | 163 | 66.60% |
| 1999 | 166.6 | 72.20% |
| 2000 | 172.2 | 77.10% |
| 2001 | 177.1 | 79.90% |
| 2002 | 179.9 | 84% |
| 2003 | 184 | 88.90% |
| 2004 | 188.9 | 95.30% |
| 2005 | 195.3 | 98.90% |
Source: Economic report of the president, 2007, Table 108, p. 354.
Graph 2: Graph showing Consumer Price Index and Inflation rate (1996 to 2005)
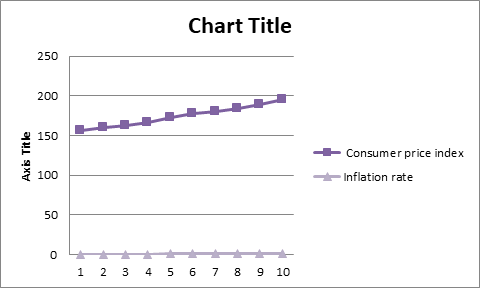
Source: created by the author using excel.
Although relative housing prices that is relative to the CPI increased in almost all metropolitan areas during the 5 years from 2000 to 2005, the increases were concentrated in a few high – profile markets; increases in most areas were only modest. For example, real prices in Los Angeles increased at a 14.3 percent annual rate, but real price increases in 71 percent of metropolitan areas were less than the 6.4 percent national average. Most house price changes reflect local conditions in such areas with restricted supply, small change in demand may translate into large price changes. Although house- price increases during these 5 years were concentrated in a few markets, the decline in mortgage rates from 2000 to 2005 was one common factor that may have helped raise home prices across the nation. In contrast to the CPI, its weights are not fixed but move to reflect changes in spending patterns. Of the two indexes, the CPI tends to increase more rapidly in part because it measures a fixed basket of goods. The “wedge,” or difference between the CPI and the GDP measures of inflation, has implications for Federal budget projections. For a given level of nominal income, increases in the CPI also cut federal revenue because they raise the brackets at which higher income tax rates apply and affect other inflation- indexed features of the tax code. The CPI measures prices for a fixed basket of consumer goods and services. It is widely reported in the press, and is used to index social security, the individual income tax, Federal pensions, and many private- sector contracts.
Conclusion
Since the Great depression it has been regarded as the second worst downturn of all time. The 2008 Financial crisis surfaced around august of 2007 whereas impacted the global economy as well. The effect of the crisis was greater when thought in term of US economy. With the rapid- growth period of the expansion fading into the past, the economy is currently going through a period of rebalancing. Where higher growth of nonresidential investment and exports are offsetting the lower rates of housing investment. The economy is projected to settle into a steady state in which real GDP grows at about 3 percent per year, the unemployment rate creeps up towards a noninflationary level( of 4.8 percent) and inflation remain moderate and stable( about 2.2 to2.6 percent on the CPI).Consumer spending is growth projected to grow a bit faster than GDP as a whole. Economic forecasts are subject to error, and unforeseen positive and negative developments will affect the course of the economy over the next several years. Given the economy’s fundamental strength, however, prospects for continued in the years ahead remain good. Nonetheless, much work remains in making U.S economy as productive as possible.
References
DAMODAR N. GUJARATI, DAWN C. PORTER, SANGEETHA GUNASEKAR (N. D). BASIC ECONOMETRICS.MCGRAW HILL EDUCATION (INDIA) PRIVATE LIMITED.
Investopedia. (n.d.). The 2007-08 Financial Crisis in Review. Retrieved from
https://www.investopedia.com/articles/economics/09/financial-crisis-review.asp
Data.worldbank.org. (n.d.). GDP (constant 2010 US$)/Data. Retrieved from
https://data.worldbank.org/indicator/NY.GDP.MKTP.KD?locations=US
GDP growth(annual%) | Data. The World Bank. Retrieved from
Smith, N. (2015). The 2000s Sure were a Horrible Decade for the US. Retrieved September 15, 2019, from Newsday website: https://www.newsday.com/opinion/oped/the-2000s-sure-were-a-horrible-decade-for-the-u-s-noah-smith-1.9876065.
ECONOMIC REPORT OF THE PRESIDENT, stransmitted to the congress February 2007, Chapter 2, Productivity growth.

Good work
LikeLike
Great job.
LikeLike
Good work
LikeLike
Really great work. Looking forward to more informative works.
LikeLike
Great report. Very informative and educational. Good job.
LikeLike
It’s just quite impressive
Fabulous work
LikeLike
Informative
LikeLike
great work keep it up dude
LikeLike
Good work
LikeLike
Good work
LikeLike
Good work
LikeLike
Good work
LikeLike
Good work
LikeLike
Good work
LikeLike
Good work
LikeLike
Good work
LikeLike
Good work
LikeLike
Good Work
LikeLike
Nice work. Waiting for more
LikeLike
Good work
LikeLike
Well done work…….
LikeLike
Great work
LikeLike
Good work
LikeLike
Good work
LikeLike
Good work
LikeLike
Good work done
LikeLike
Very informative.
LikeLike
Great work yrr..I like it…well done…
LikeLike
Heavy projects
LikeLike
I just love it……awesome…
LikeLike
GOOD JOB.
LikeLike
Nice
LikeLike
Osm…….
LikeLike
Good work, very informative.
LikeLike
Very good work
LikeLike
Great job
LikeLike
Superb job
LikeLike
Nice work 👍
LikeLike
Good work
LikeLike
Fabulous work
LikeLike
Osm.. work
LikeLike
Nice work
LikeLike
Great job
LikeLike
Good work
LikeLike
Nice work
LikeLike
Great work
LikeLike
Nice project
LikeLike
osm..
LikeLike
Good work
LikeLike
Well done.
LikeLike
Good
LikeLike
Good
LikeLike